| Table 1. Study Cohorts and Dose Levels | |||
|---|---|---|---|
| Cohort | Dose | N | Status |
| Cohort A (10 mg) | 10 mg | 8 | Complete |
| Cohort B (30 mg) | 30 mg | 8 | Complete |
| Cohort C (100 mg) | 100 mg | 8 | Complete |
Phase I | Study XYZ-001
Single Ascending Dose | Interim Safety & PK Readout
Aslane Mortreau · Data & AI Specialist
2025-03-01
Study Design
Objectives
- Primary: safety and tolerability
- Secondary: PK characterization, dose-proportionality
Design
- Open-label, sequential dose escalation
- 3 cohorts × 8 subjects = 24 subjects
- Single oral dose per cohort
- 24-hour PK sampling
Data cut-off: 2025-03-01 | Safety Analysis Set (N=24)
Key Metrics
24
Subjects enrolled
5.8 h
Mean terminal half-life
Supports once-daily dosing
2 h
Median Tmax
0
Serious adverse events
All TEAEs mild or moderate
Pharmacokinetics
NCA · Concentration-Time · Dose Proportionality
PK Profiles: Linear Scale
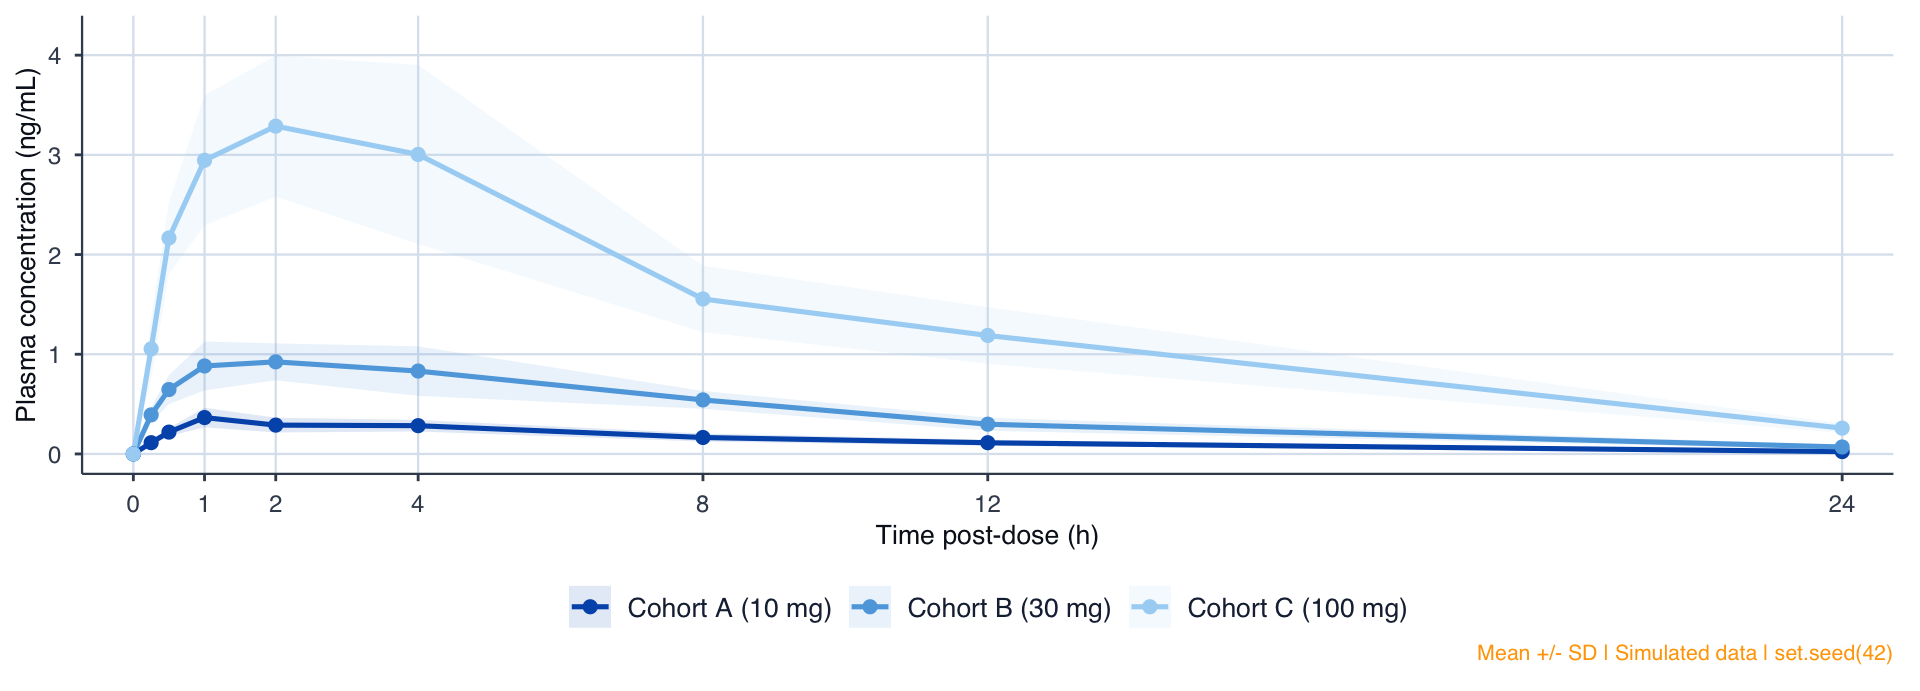
Figure 1. Mean Plasma Concentration-Time Profile (Linear Scale). Mean ± SD. PK Analysis Set (N=24).
PK Profiles: Semi-Log Scale
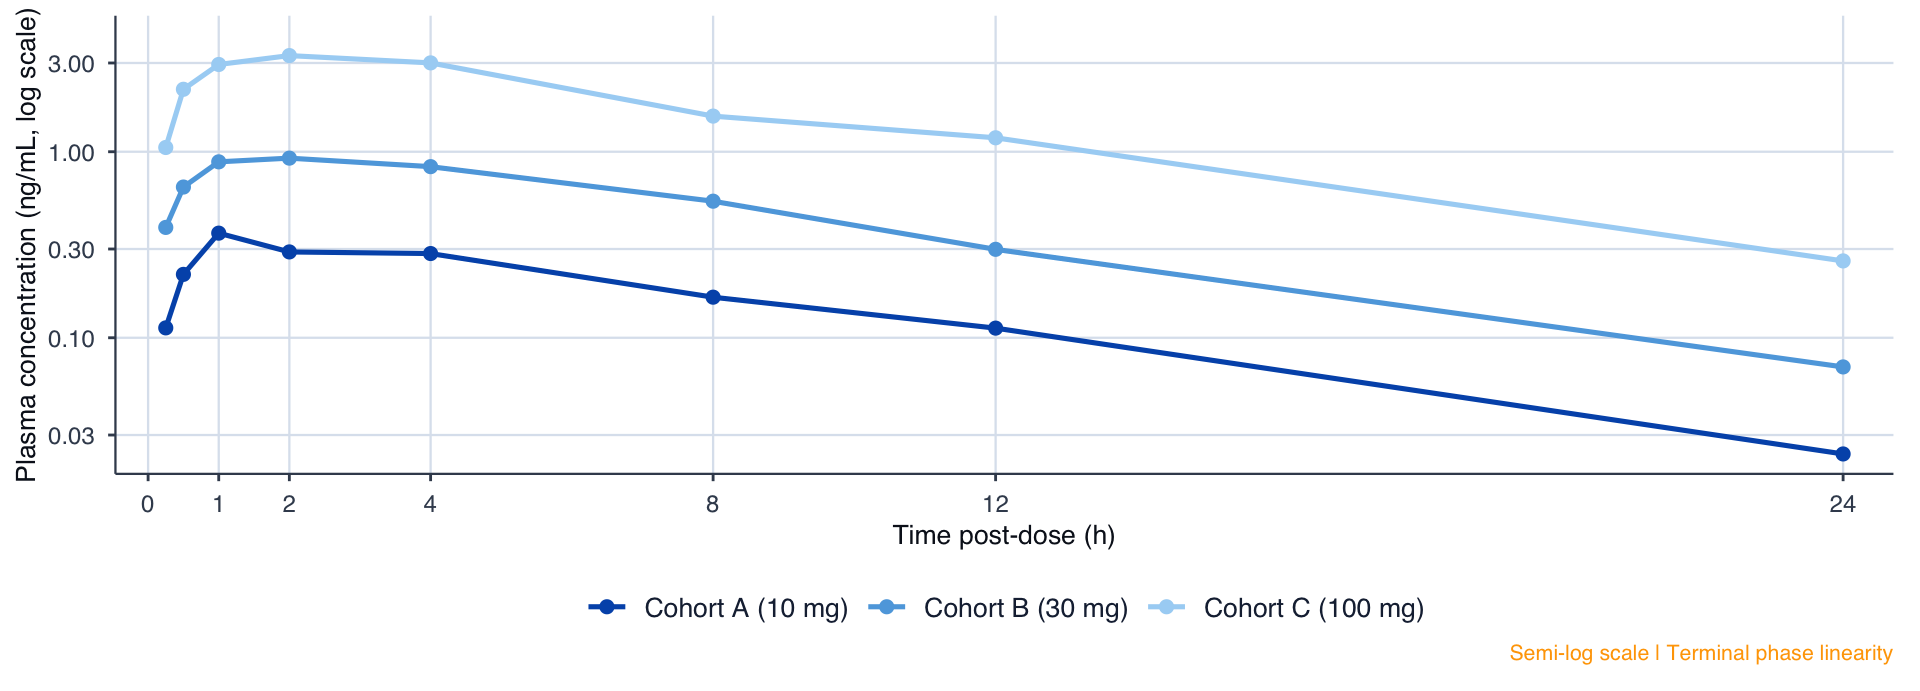
Figure 2. Mean Plasma Concentration-Time Profile (Semi-Logarithmic Scale). PK Analysis Set (N=24).
NCA Parameters
| Table 2. Non-Compartmental Pharmacokinetic Parameters | |||||
|---|---|---|---|---|---|
| Cohort | N | Cmax | Tmax | AUClast | t1/2 |
| Cohort A (10 mg) | 8 | 0.4 (0.1) | 1.0 [1.0, 2.0] | 3 (0) | 5.9 (0.7) |
| Cohort B (30 mg) | 8 | 1.1 (0.2) | 2.0 [1.0, 4.0] | 10 (1) | 5.8 (0.8) |
| Cohort C (100 mg) | 8 | 3.7 (0.6) | 2.0 [1.0, 4.0] | 35 (2) | 5.8 (0.7) |
| Cmax: ng/mL | AUClast: ng.h/mL | t1/2: h | Mean (SD) except Tmax: Median [Min, Max] | |||||
Dose proportionality
10-fold dose increase yields ~9.8-fold AUC increase. Approximate proportionality across 10-100 mg. Formal power model analysis pre-specified in SAP.
Safety
TEAEs · Severity · Laboratory Findings
Adverse Events Overview
| Table 3. Overview of Treatment-Emergent Adverse Events | ||||
|---|---|---|---|---|
| Cohort | Any TEAE | Mild | Moderate | Serious |
| Cohort A (10 mg) | 4 (50%) | 4 | 1 | 0 |
| Cohort B (30 mg) | 3 (38%) | 3 | 1 | 0 |
| Cohort C (100 mg) | 4 (50%) | 4 | 3 | 0 |
Key observations
- No SAEs across all cohorts
- All TEAEs mild or moderate
- No dose-limiting toxicities
- One ALT elevation in Cohort C, mild, resolved
Source: Simulated ADAE | TEAE: onset on or after first dose
TEAEs by System Organ Class
| Table 4. Treatment-Emergent Adverse Events by System Organ Class and Preferred Term | |||
|---|---|---|---|
| Preferred Term | Cohort A (10 mg) | Cohort B (30 mg) | Cohort C (100 mg) |
| Gastrointestinal disorders | |||
| Nausea | 1 (12%) | 1 (12%) | 1 (12%) |
| General disorders | |||
| Fatigue | 1 (12%) | 0 | 1 (12%) |
| Infusion site reaction | 1 (12%) | 0 | 4 (50%) |
| Investigations | |||
| ALT increased | 0 | 1 (12%) | 0 |
| Nervous system disorders | |||
| Dizziness | 2 (25%) | 1 (12%) | 1 (12%) |
| Headache | 0 | 1 (12%) | 0 |
Conclusions
Safety · PK · Next Steps
Key Findings
Safety Favourable
- No SAEs or DLTs at any dose level
- All TEAEs mild or moderate
- Single mild ALT elevation in Cohort C, resolved
PK On target
- Dose-proportional exposure across 10-100 mg
- Median Tmax 2 h, mean t1/2 5.8 h
- Supports once-daily dosing
Recommendation
Next step
All cohorts met safety criteria for escalation. Recommend proceeding to multiple ascending dose phase. Dose range: 10-100 mg once daily.
Monitor
Continue ALT/AST monitoring in MAD phase. Pre-specify liver enzyme stopping rules in protocol.
Session Information
| Computational Environment & Dataset Provenance | |
|---|---|
| Item | Value |
| R version | 4.5.2 |
| Platform | aarch64-apple-darwin20 |
| OS | macOS Sequoia 15.6 |
| Report rendered | 2026-03-12 09:59:26.797944 |
| Rendered by | aslanemortreau |
| Package Versions | |
|---|---|
| Package | Version |
| haven | 2.5.5 |
| dplyr | 1.1.4 |
| tidyr | 1.3.1 |
| gt | 1.1.0 |
| ggplot2 | 4.0.0 |
| scales | 1.4.0 |
| digest | 0.6.37 |
| survival | 3.8.3 |
| survminer | 0.5.2 |
| emmeans | 1.11.1 |
| mmrm | 0.3.15 |
Reproducibility
quarto render slides-example.qmd --no-cache

# Dataset: simulated with set.seed(42)
# Key packages: dplyr, ggplot2, gt
Audit trail
In production, replace simulated data with load_verified() calls that check SHA-256 checksums at render time. Every number traces to a locked ADaM dataset.
Generated: 2026-03-12 09:59:26.870786 | Rendered by: aslanemortreau